
The 10 Marketing KPIs Every Construction Company Should Be Tracking

Construction companies track everything on the project side, including schedule, budget, safety, and quality. On the marketing and business development side, most companies track nothing. This post walks through the 10 KPIs that give you real visibility into how your marketing is performing, why each one matters, and the three you should start with today if you're measuring nothing right now.
Why Construction Firms Don't Measure Their Marketing
Ask a project manager at any commercial construction firm how the job is tracking and they'll give you a number in seconds. They can tell you the schedule performance index, cost variance and RFI count. The project side of construction is metrics-driven by necessity.
Ask the same company how their marketing is performing and you'll usually get a pause, then a story. "We've been getting some good referrals." "We just submitted a big proposal." "LinkedIn seems to be getting more traction."
While these are promising anecdotes, stories aren't metrics. And without metrics, you can't improve.
The reason most construction firms don't measure their marketing comes down to two things: they don't know which numbers to track and they haven't assigned anyone to track them.
The Top 10 Marketing KPIs for Construction Companies
These are the top 10 metrics that, together, give you a complete picture of your marketing and business development performance. Not every company will track all 10 immediately, but every company should know which ones they're missing.
1. Win Rate
What it measures: The percentage of proposals you submit that result in a contract award.
Win rate is the single most important BD metric for a commercial contractor. A 25% win rate means you're winning one in four. A 45% win rate means you're nearly winning every other pursuit. The difference, compounded over a year of estimating hours and BD investment, is enormous.
Win rate also tells you whether your pursuit filter is working. If you're winning 10% of proposals, you're probably chasing too many poor-fit opportunities. If you're winning 70%, you might not be pushing into enough new territory.
Formula: Contracts awarded ÷ proposals submitted × 100
2. Proposal Volume
What it measures: The number of proposals submitted per quarter.
Proposal volume on its own is a vanity metric as submitting more proposals doesn't mean winning more work. But paired with win rate, it tells you whether your pipeline is generating enough qualified opportunities to hit your revenue goals.
If your win rate is 30% and you need to win eight projects this quarter, you need to submit approximately 27 proposals. If your pipeline only generates 12 proposals, you have a pipeline problem, not a proposal problem.
3. Revenue by Source
What it measures: Where your revenue comes from (referrals, repeat clients, inbound website leads, events, cold outreach, associations, etc.).
This is one of the most underused KPIs in construction marketing and one of the most revealing. Most firms, when they first calculate revenue by source, discover that 70-85% of their revenue comes from repeat clients and referrals from just two to three relationships. That concentration is both a strength and a vulnerability.
Knowing your revenue sources tells you where to protect relationships, where to invest, and where new channel development could reduce your dependence on a small number of referral pipelines.
4. Client Retention Rate
What it measures: The percentage of clients who hire you for a second (or third) project.
In commercial construction, repeat client relationships are the most profitable BD activity you can pursue. The cost of winning a repeat client is a fraction of the cost of winning a new one — and repeat clients rarely put you in hard-bid situations.
A retention rate below 50% signals a relationship management or delivery problem. A retention rate above 70% is a competitive moat worth protecting and leveraging in your marketing.
Formula: Clients who returned for a second project ÷ total clients from the prior period × 100
5. Referral Rate
What it measures: The percentage of new opportunities that come from referrals, and which sources generate the most.
Referrals are the dominant pipeline source for most commercial contractor, but few companies track them rigorously enough to know which relationships are actually driving revenue. Tracking referral rate by source—like client, architect, subcontractor, association, or past employee—tells you exactly which relationships to prioritize, protect, and reciprocate.
It also quantifies the ROI of relationship-building activities like events, golf outings, and industry association involvement—something most companies can't answer when asked.
6. Website Leads
What it measures: The number of qualified inquiries generated through your website per month.
For most commercial contractors, their website generates close to zero leads. Not because the website can't, but because it hasn't been built to generate leads. A website without a lead magnet, a clear CTA, or a compelling reason to make contact is a just digital brochure, and likely won’t support business development efforts.
Tracking website leads, even if the number is currently zero, creates the baseline you need to measure improvement as you invest in SEO, content marketing, and conversion optimization.
7. Average Project Value
What it measures: The average dollar value of the projects you win.
Average project value is a strategic metric as much as a financial one. If your goal is to move upmarket, like winning larger, higher-margin projects with sophisticated owners, tracking average project value tells you whether your marketing and BD strategy is actually working toward that goal.
It also informs your resource allocation. A company winning $500K projects needs a different marketing system than one winning $5M projects.
8. Pipeline Value
What it measures: The total dollar value of active opportunities in your pursuit pipeline, weighted by probability of winning.
Pipeline value is your forward-looking revenue indicator. It tells you whether you have enough qualified opportunities in play to hit your revenue targets and how much of that pipeline is actually likely to close.
A healthy pipeline value should be 3-5x your quarterly revenue target (accounting for your win rate). If your pipeline is thin, you have a BD activity problem. If it's fat with low-probability pursuits, you have a qualification problem.
Formula: Sum of (opportunity value × estimated win probability) for all active pursuits
9. Cost Per Lead
What it measures: Your total marketing spend divided by the number of qualified leads generated.
Cost per lead forces accountability on marketing spend. If you're spending $5,000 per month on a marketing retainer and generating two qualified leads, your cost per lead is $2,500. If a targeted LinkedIn content strategy generates eight leads for $500 in time investment, the math changes dramatically.
This metric is harder to calculate precisely in construction BD, as the line between marketing and relationship-building is blurry. But, even a rough estimate creates useful decision-making data.
Formula: Total marketing spend ÷ number of qualified leads
10. Time to Close
What it measures: The average number of days from first contact with a prospect to a signed contract.
Time to close is a pipeline efficiency metric. Long close times (18+ months from first contact to contract) are normal in commercial construction. Tracking them helps you understand your pipeline timing, forecast revenue more accurately, and identify bottlenecks in your BD process. This metric may not be able to shorten the long close times we’re used to experiencing, but it will certainly keep them from getting unnecessarily longer.
It also informs your content and nurture strategy. If prospects typically take 14 months to move from lead to contract award, you need a 14-month nurture system, not a 30-day one.
How to Score Your Current Measurement System
The CMN Top 10 KPI Checklist asks three questions for each KPI: Do you track it? Do you know your current number? Do you review it at least quarterly? That's 30 yes/no answers, giving you a score out of 30.
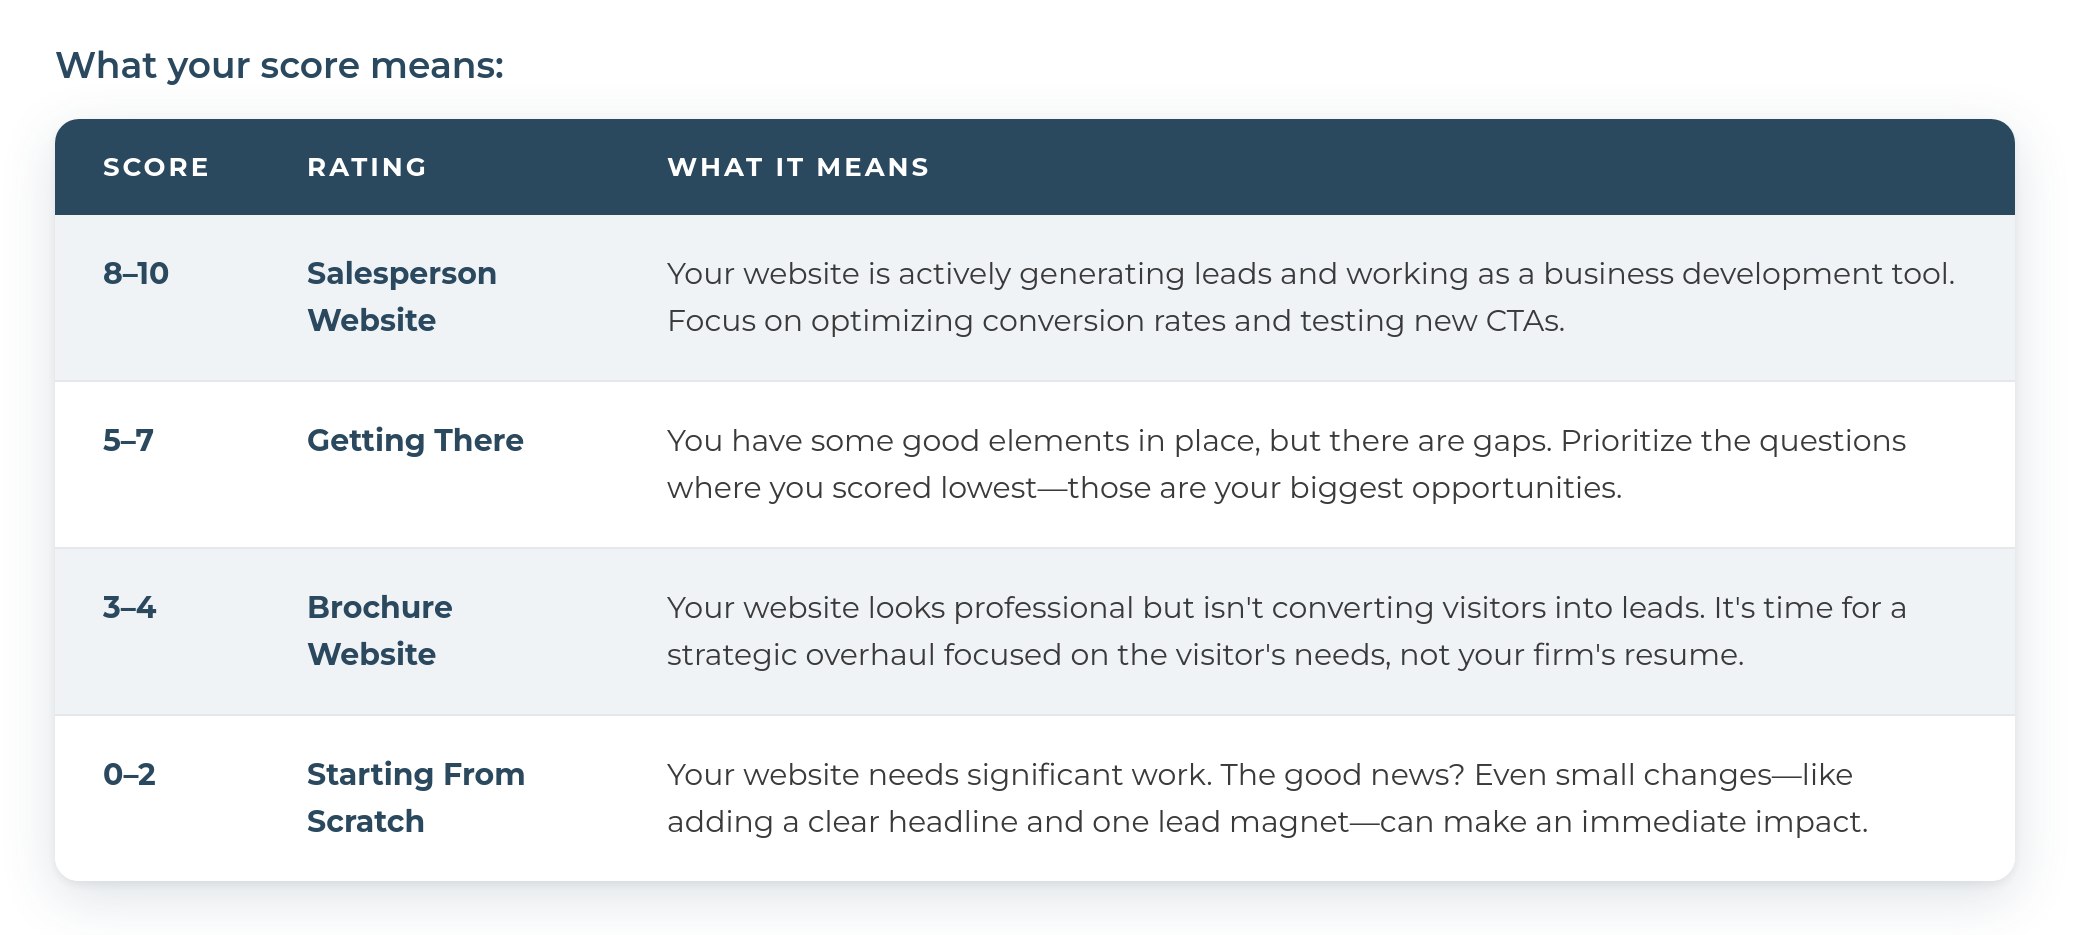
Most commercial contractors land in the "Mostly Guessing" range when they take this assessment honestly. Don’t view it as a failure. It's a starting point to tracking what really matters in the future.
The 3 KPIs to Start With Right Now
If you're tracking nothing today, don't try to build a 10-metric dashboard overnight. Start with these three. They give you more marketing visibility than the majority of construction companies have, and you can calculate all three before the end of the week:
1. Win Rate: Pull your last 12 months of proposals submitted and contracts awarded. Calculate the percentage. That's your baseline. Review it quarterly.
2. Revenue by Source: Look at every project won in the last 12 months. For each one, identify how the relationship originated. Was it a repeat client, a referral (from whom?), or was it inbound, an event, or cold outreach? Total the revenue in each bucket. The picture this creates is almost always surprising.
3. Pipeline Value: List every active pursuit you're currently tracking. Assign a dollar value and a probability percentage to each one. Multiply and sum. That's your weighted pipeline. Review it in your BD meeting every week.
What Measuring Your Marketing Actually Changes
The goal of tracking KPIs isn't about the tracking itself, but rather the decisions it enables.
When you know your win rate, you can set a rational proposal volume target. When you know your revenue by source, you can protect your highest-value relationships deliberately instead of accidentally. When you track pipeline value weekly, your BD conversations shift from "how are things going" to "what needs to move this week."
CMN’s Contacts to Contracts Framework is built on the premise that construction companies can grow systematically, not just reactively. Measurement is what makes systematic growth possible. Without it, you're making decisions based on stories and instincts. With it, you're making decisions based on evidence.
Your Next Step
Download the free Top 10 KPI Checklist and take 15 minutes to audit your current marketing measurement. Three yes/no questions per KPI and a scoring rubric that tells you exactly where you stand will give you a clear priority list of where to start.